Seeing the Network Through Your User’s Eyes
Monitoring at a University
In a former life at an academic institution, we had a pretty solid set of monitoring solutions in place: Nagios and Cacti to monitor servers and services, coupled with SolarWinds NPM and Prime Infrastructure to monitor the network. Between the 4 tools, you could at least deduce the health of the data center if not outright know for certain its health.
However, there were two pretty glaring blind spots IMO in the network: the campus wired and wireless network - okay, really it was mostly wireless. To the point though, it wasn’t whether physical switches or APs were up and functional - that’s easy - it was whether clients could get to the services they needed with a good user experience.
Those 4 tools, at least the way we had implemented them, were certainly not providing that view.
To get that visibility, you would need the analog of a Nagios server running on every single wired/wireless client checking response times of the gateways, how long it took to query the campus DNS/web/LDAP servers, Google, Office365, etc. And, honestly, having the historical performance data is the real gold mine - help desk tickets rarely are delivered in a timely fashion and the problems are often transient so being able to view performance an hour, a day, or a week ago can make all the difference!
NFD12
There were several vendors presenting at Networking Field Day 12 (http://techfieldday.com/event/nfd12/) where I had the privilege of being a delegate for the three days of sessions. A few of them were looking to fill exactly this kind of blind spot in the network. Each one though, in my humble opinion, had a different target “demographic” for the product they were evangelizing. There was one presentation though that wasn’t aimed (in my opinion) at ripping out your existing tools…
NetBeez
NetBeez (https://netbeez.net) overviewed and demonstrated their Beez and BeezKeeper product. The concept is fairly straightforward and not overly complex. Distributed agents with a central management console - stop me if you’ve heard that before. However, what struck me as interesting about NetBeez was:
- The reason they started the company spoke exactly to the blind spots we experienced in our operations! (see https://vimeo.com/178818193 from start until 02:30 mark)
- The little hardware agents you can buy are built on Raspberry Pi (or similar) devices running Ubuntu. So there is potential for monitoring anything that you can script up under a Linux environment.
- The command/control functions were available in an onsite appliance (OVA) that will receive and store all the metrics. This helps calm the privacy and data security concerns that can accompany a cloud service.
- Of keen interest, you were not required to install software on client devices or even touch them in any way to gather this “end user monitoring” data.
At this point, you should pause because the last reason contradicts what I had said I was originally looking for (Nagios running on every client). And, that’s true. Except…
At an academic institution, you don’t own a vast majority of the end user devices and therefore can’t forcibly install this kind of software on them. Even the machines the institution buys for faculty are typically verboten.
That’s where reason #1 comes into play. Using IT owned clients, you can still perform the monitoring you need (namely, what the network looks like from the user’s perspective) without dealing with client agents on student or faculty machines.
You still have clients/agents - the Beez - but they are centrally managed and can be placed in a network closet or anywhere near a network jack. They connect to the network just like other client devices, whether by wire or wireless, in order to probe the network.
A Look at the BeezKeeper Portal Data
Below are some screenshots of the type of data (wired) that the Beez will monitor and collect. The supported tests right now are:
- ping - for reachability
- DNS - how quickly the name resolves
- traceroute - test path to specified target
- HTTP - basic HTTP GET requests
- iperf - requires a iperf target
- speedtest - leverages the CLI based Oookla speedtest service
- VoIP - latency, jitter, delay, MOS
First up, some historical ping data from my Beez to the Tech Field Day website, during a period where some substantial changes in ping RTT occurred:
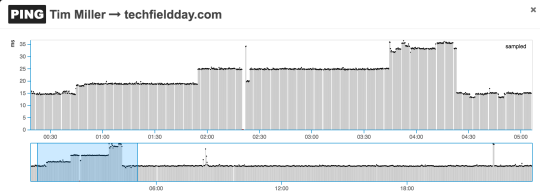
As you can make out in the plots, this is pretty late at night and I certainly wasn’t doing anything on the network. So, let’s take a look at the traceroute data, focusing around the 01:50 time frame. First, the “before” scenario:
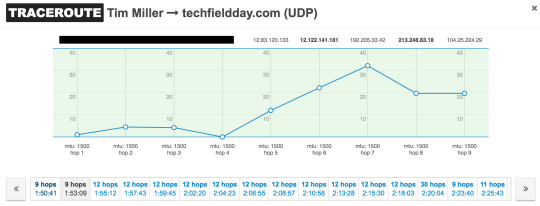
Now, the “after” scenario:
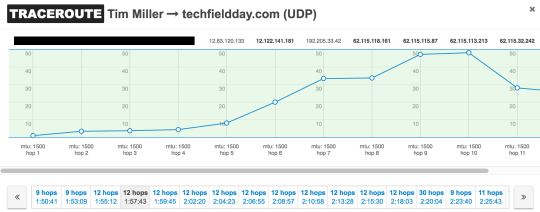
You can see not only did I add 3 hops to my route but that I went from a single hop with 35ms RTT to multiple hops with 35ms RTT or greater. And, at 03:44, you can see another significant routing change occur:
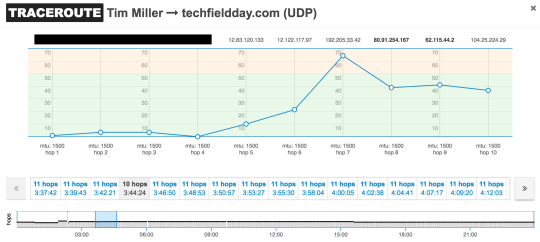
What’s clear from these plots is that I was having some performance degradation and some routing changes were taking place in the path to the specified target (namely, techfieldday.com). What this data doesn’t show, though, is the return path traceroute - not unexpectedly, though, given the architecture. It is a crucial component in the monitoring picture.
Why, you ask? The reason being that the traceroutes - excluded here for the sake of length - look fairly normal and quite nice (RTT around 25ms or less, 11 hops or less) - even during the 03:50 to 04:20 period. I do not think that the return path playing a significant role here is an unreasonable deduction in this case.
Fortunately, better path analysis is a feature on their near term road map!
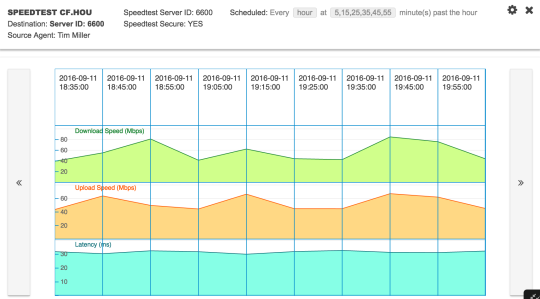
Just for kicks, here are the historical data from the speedtest monitoring the Beez was conducting:
Sweet Nectar or Angry Swarm?
As much as I love the Raspberry Pi angle and the Linux/IoT angle to the product, the test suite is what could be termed the core, basic tests for a remote network agent. As such, I think there are a couple of checks that are really lacking - especially for small to medium businesses (which I think is a natural play for the product):
- Directory checks! Whether Active Directory or OpenLDAP, I think it would be very crucial to know if clients are having issues connecting or authenticating against the directory service. You definitely have to be careful on how this gets implemented though!
- Web Service checks! Currently, the HTTP checks seem to only perform a “GET /” request. While that does test reachability and exercise the web server a little bit, it doesn’t necessarily exercise the login or Ruby/Tomcat/name_your_favorite_stack aspects of the site. Support for Salesforce or calling REST APIs on a site to exercise the app engine would go a long way.
- Mail checks! Exchange/OWA/POP/IMAP does not matter - at the very least, testing the SMTP protocols enough to know that the service is up. Ideally, with the onsite appliance, be able to trigger a special monitoring email to be sent through email system with ultimate deliver to the appliance for metrics.
- For Beez deployed at remote sites, I’d even add the ability to test the VPN connectivity - whether that’s the ability to connect via remote access or site-to-site mechanisms or simply have a mechanism to recognize or classify metrics transit a tunnel.
Honestly though , in regards to e-mail checks, as most academic institutions are running to the free email services of Google and Microsoft, this might not be as critical as it once was. Outside of academia, though, email drives communication which drives revenue so your mileage may vary.
Those suggestions I provide are on top of the roadmap they announced at NFD12 (https://vimeo.com/178818193, 17:27 mark). I would say the container support is probably the lowest hanging fruit and biggest win, especially given the continuing trend of vendors moving toward containers running directly on switch hardware.
Additionally, as suggested by another delegate, container based agents could be more easily integrated into a CI-based unit testing workflow very easily to allow more comprehensive testing of application changes.
Too Much to Talk About
The Beez can also monitor wireless service but I don’t have the wireless model so didn’t get a chance to play with that at all. Wired is nice but we all know wireless is where almost all users reside. Blindly wishing here - I’d love to see a wireless Beez collect signal strengths for neighboring APs and any other client devices in the area.
On the portal, we delegates had a great deal of internal discussion about it (layout, visibility, etc) and opinions varied greatly. I can’t stand developing web portals myself (I miss the blink tag) so I’m not about to critique any else’s web design.
My only real difficulty with the web site is remembering/finding the location to add/remove agents to/from monitoring targets. Everything else to me seemed to be found in the right locations for the use cases to which they were designing.
“Super short” wrap up
As a Linux engineer, I am very intrigued by what they are doing and definitely want to see them succeed where they have a market play. At this time, I think the Beez product would be a good complement to an existing set of more sophisticated (Linux-based scripted service monitoring checks).
Which is a good place to be for them - after all, they even admitted in the overview talk that the product was born of a desire for more visibility from the end user perspective beyond what their existing tools were providing. To that end, I think they’ve definitely laid the foundation of that goal with the features they’ve shown at NFD12.
As the ability to extend the checks that run on the Beez is supported, more involved monitoring actions can be scripted and run in a coordinated, distributed fashion. Maybe the product develops into a comprehensive solution?
They’ve got some work ahead of them but, by using Linux at the core, they’ll have a flexible, customizable foundation that will give them a leg up on products whose features are less extensible.
Supplemental Disclaimer
As a refresher, be sure to review my full blog disclaimer.
Panos and Stefano over at NetBeez provided the NFD12 delegates with a free, hosted service account as well as one of the Raspberry Pi based Beez (for 100Mbps monitoring).
This account and the Beez were provided as a giveaway for attending Networking Field Day 12 and were not provided with any requirement to write about the product or service.
I simply love the Raspberry Pi concept and support novel uses of the technology. I think the product has a good start with the Beez concept and wish them well.
And, as stated before, I’m a Linux engineer (among other things) and have used Linux since the early 90s. I might have a (more than) slight bias for Linux based products. Just saying.